The makers of FinnSurveyText introduce the resource through a demo guide and describe the process of creating an open-source tool for research.
Finnsurveytext is an R package that has been created to help social science and humanities researchers analyse and understand responses to open-ended survey questions in Finnish. This package has been recently added to CRAN, R’s central software repository that contains an archive of the latest and previous versions of the R distribution, documentation, and contributed R packages. Adeline Clarke from the Helsinki Centre for Social Data Science is involved in the creation and development of finnsruveytext in the framework of DARIAH-FI as a joint collaboration between Universities of Helsinki, Eastern Finland, Jyväskylä and Turku. In this blog post, she describes how finnsurveytext works and how it was to contribute this open-source tool to CRAN.
Open-ended survey questions are often very informative as they provide further context for other responses in a survey and may even contain ideas which have not previously been considered by researchers. However, since open-ended responses consist of text data and are less constrained in terms of content, data from open-ended questions can be difficult to analyse. This means that they are often underutilised in research despite their advantages, especially when the survey has many responses, making closed reading infeasible. Additionally, there are few free tools available for small languages such as Finnish. Through our package, finnsurveytext, we aim to lower the threshold for using open-ended survey questions in research by providing a user-friendly way for researchers to be able to begin analysing these open-ended questions without requiring costly tools or advanced programming skills.
Our finnsurveytext package includes comprehensive examples which guide users – including those inexperienced with using the R programming language – to get started with analysing text data. In the following is a demo using data from the Young People’s Views on Development Cooperation 2012 which is freely available for researchers from the Finnish Social Science Data Archive.
We look at open-ended question 11.3 ‘Jatka lausetta: Maailman kolme suurinta ongelmaa ovat… ’ (‘Continue the following sentence: The three biggest problems in the world are… ’). Below we output the following break down of answers to this question:
- wordclouds;
- most frequent word and n-grams tables;
- summary tables;
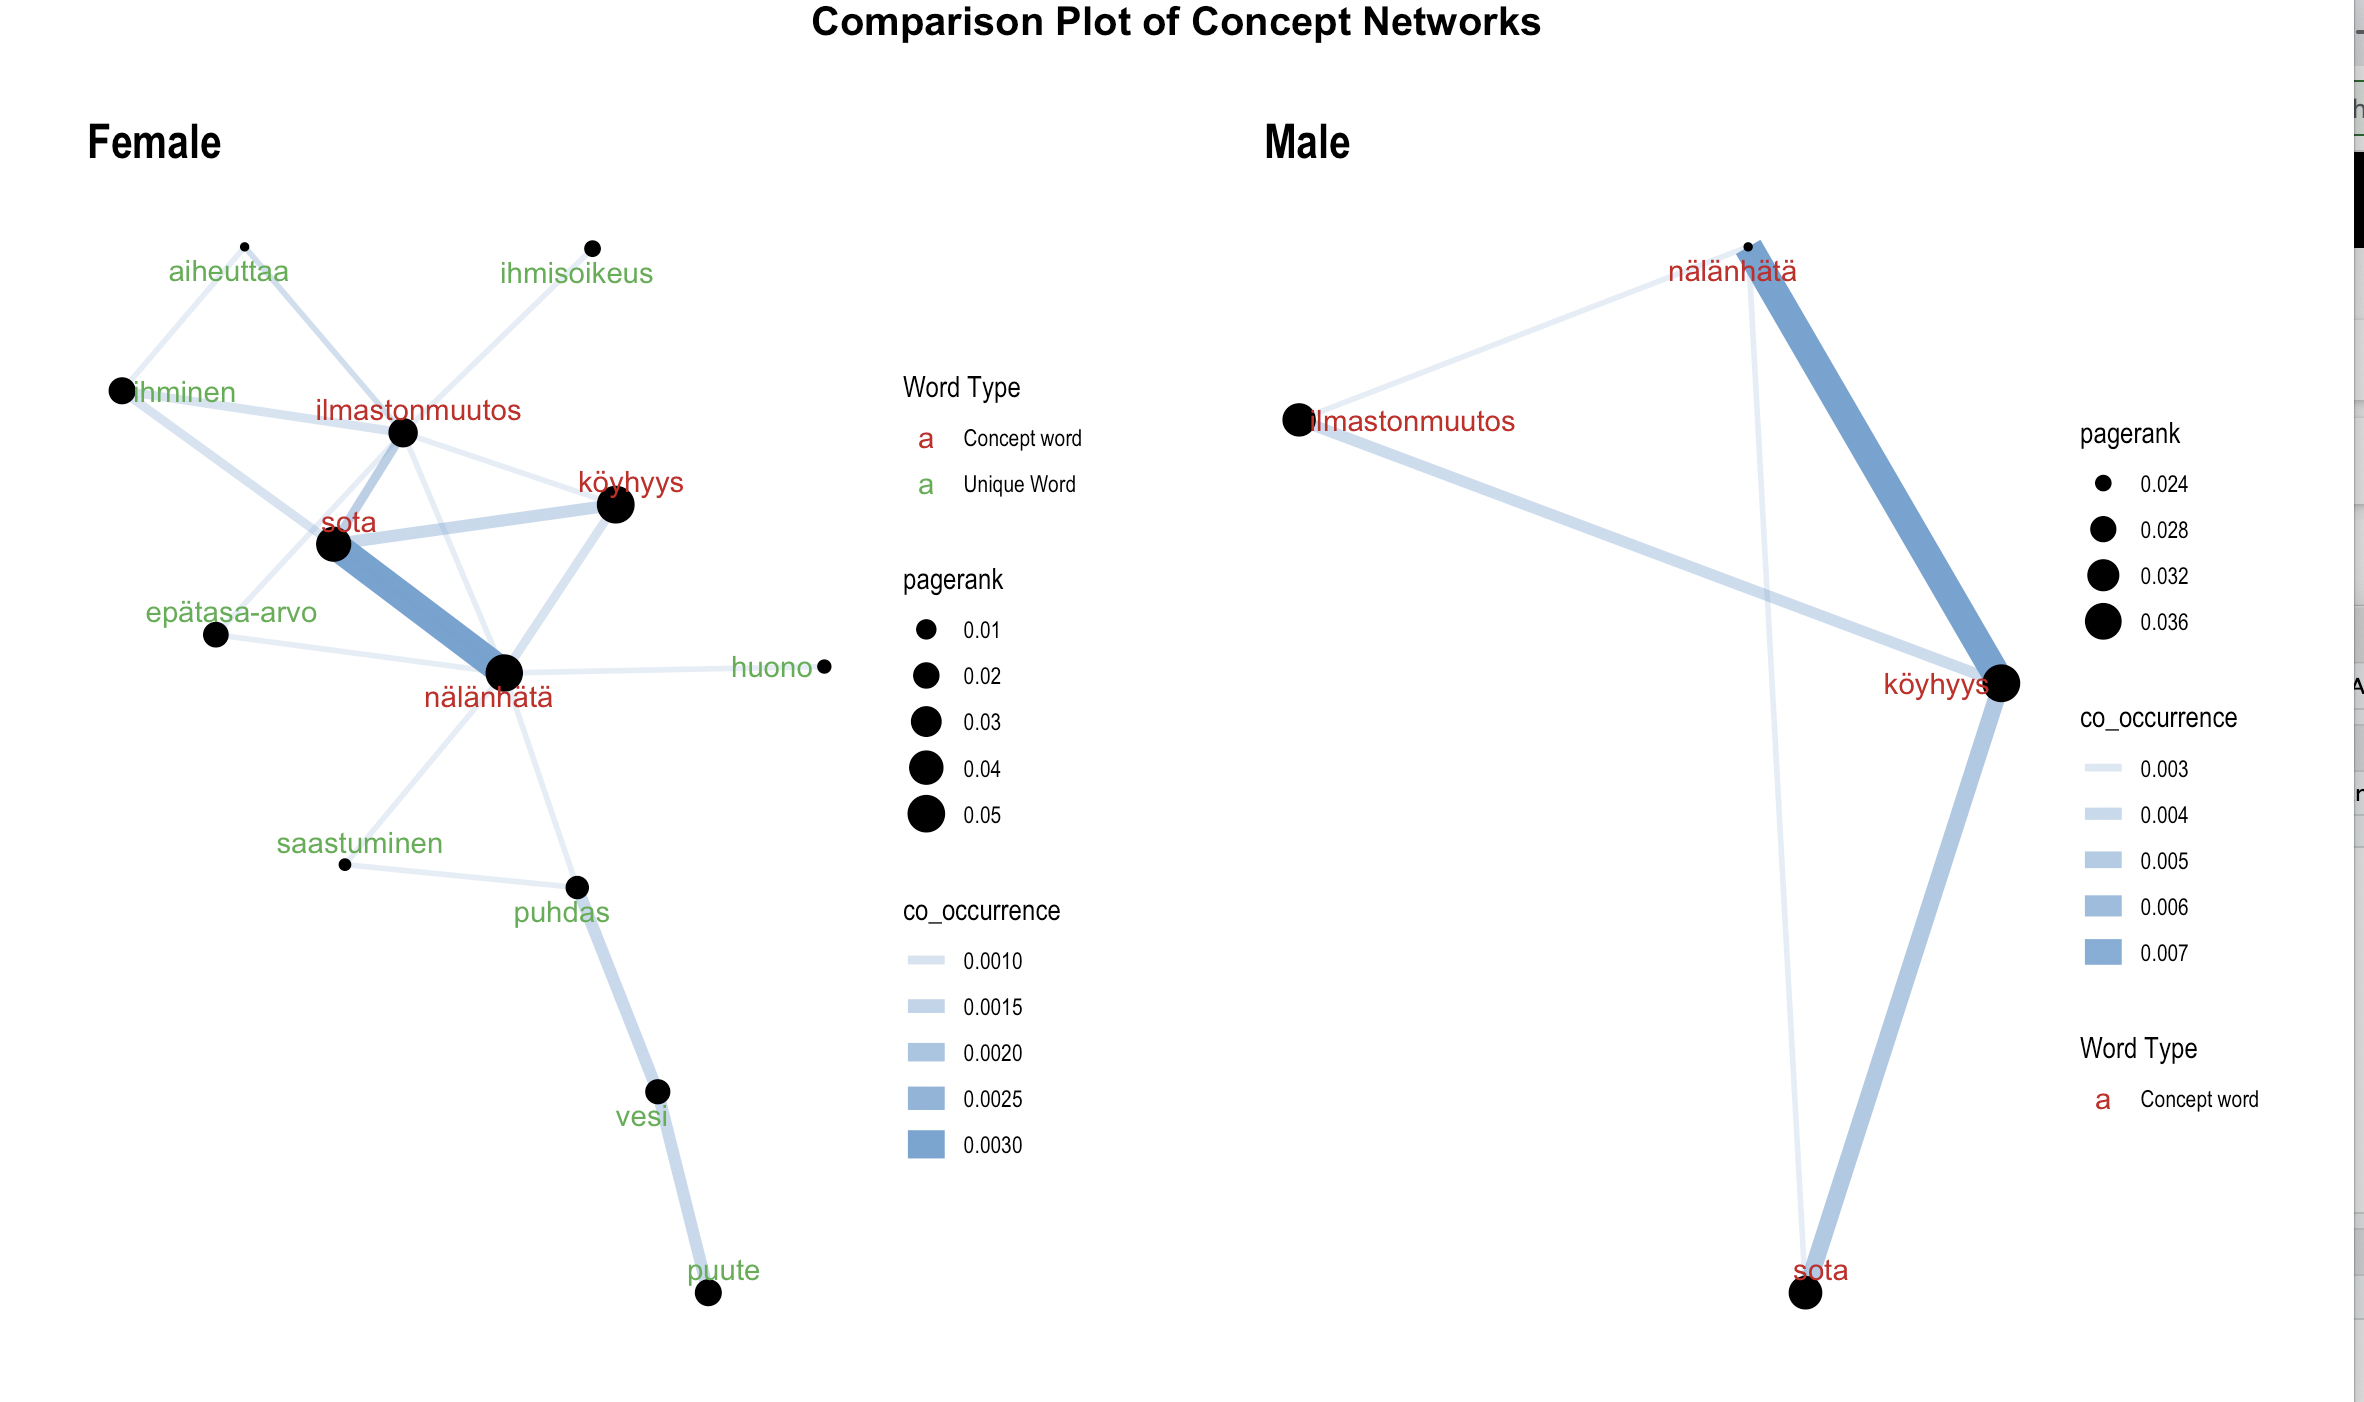
- concept network visualisations; and,
- comparison visualisations.
Text preprocessing
Our package is used firstly to preprocess the text data into a standardised format that is suitable for analysis in R. finnsurveytext currently supports two Finnish language models, the Turku Dependency Treebank (TDT) and FinnTreeBank (FTB). The TDT is considered “broad coverage” and includes texts from Wikipedia and news sources, and FTB consists of manually annotated grammatical examples from Web Version of the Large Grammar of Finnish (VISK). The result is a highly structured organisation of responses in a table in which responses are listed as sentences and each of its structural units (tokens) are given machine-readable labels to enable counting and further processing.
Exploratory data analysis
This stage involves running functions which allow the researcher to better understand the responses and begin to formulate initial hypotheses based on the data. The first of these functions create summary tables for word type (part-of-speech tag), response length, and response rate. These can help researchers to answer questions about how participants have tended to respond such as:
- What proportion of participants responded?
- Is there a lot of variation in the lengths of responses?
- Do the responses use descriptive words?

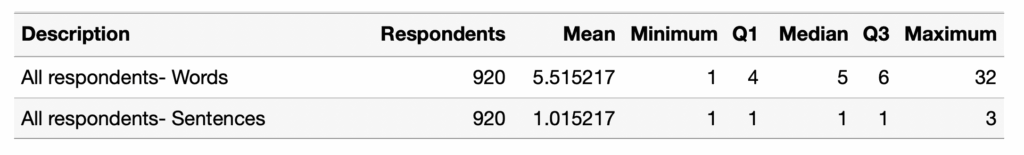

For instance, in these examples we can see that almost all (97%) participants answered this question, that most responses consisted of a single sentence of a few words, and that most words were nouns, adjectives and verbs.
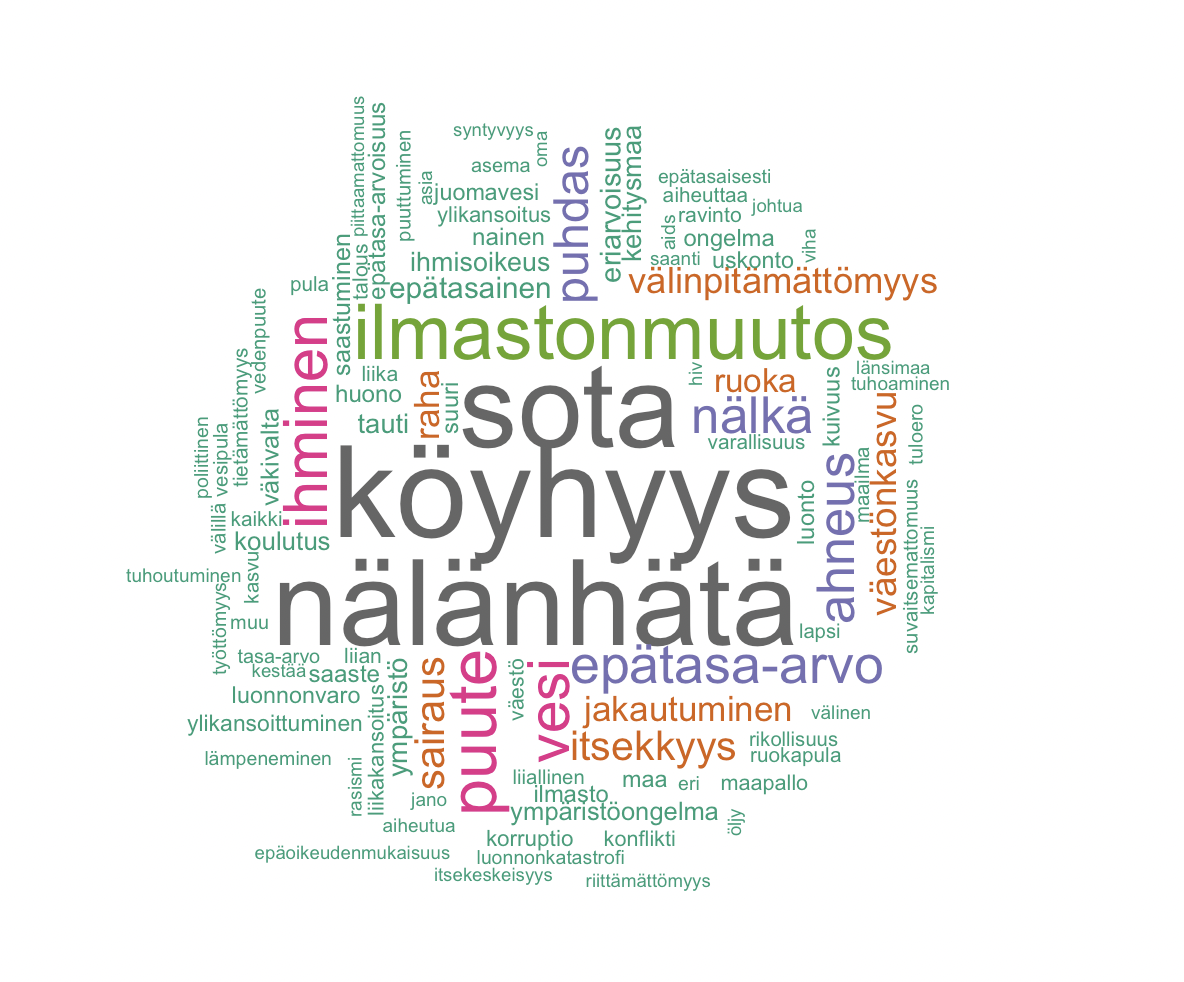
Then, there are functions to create wordclouds of responses, and tables and plots of most frequent words or n-grams. Wordclouds are included as these are familiar visualisations which enable us to clearly see which words are the most commonly occurring in the responses. In our example data, we can see that ‘sota’, ‘köyhyys’, and ’nälänhätä’ are the most common responses.
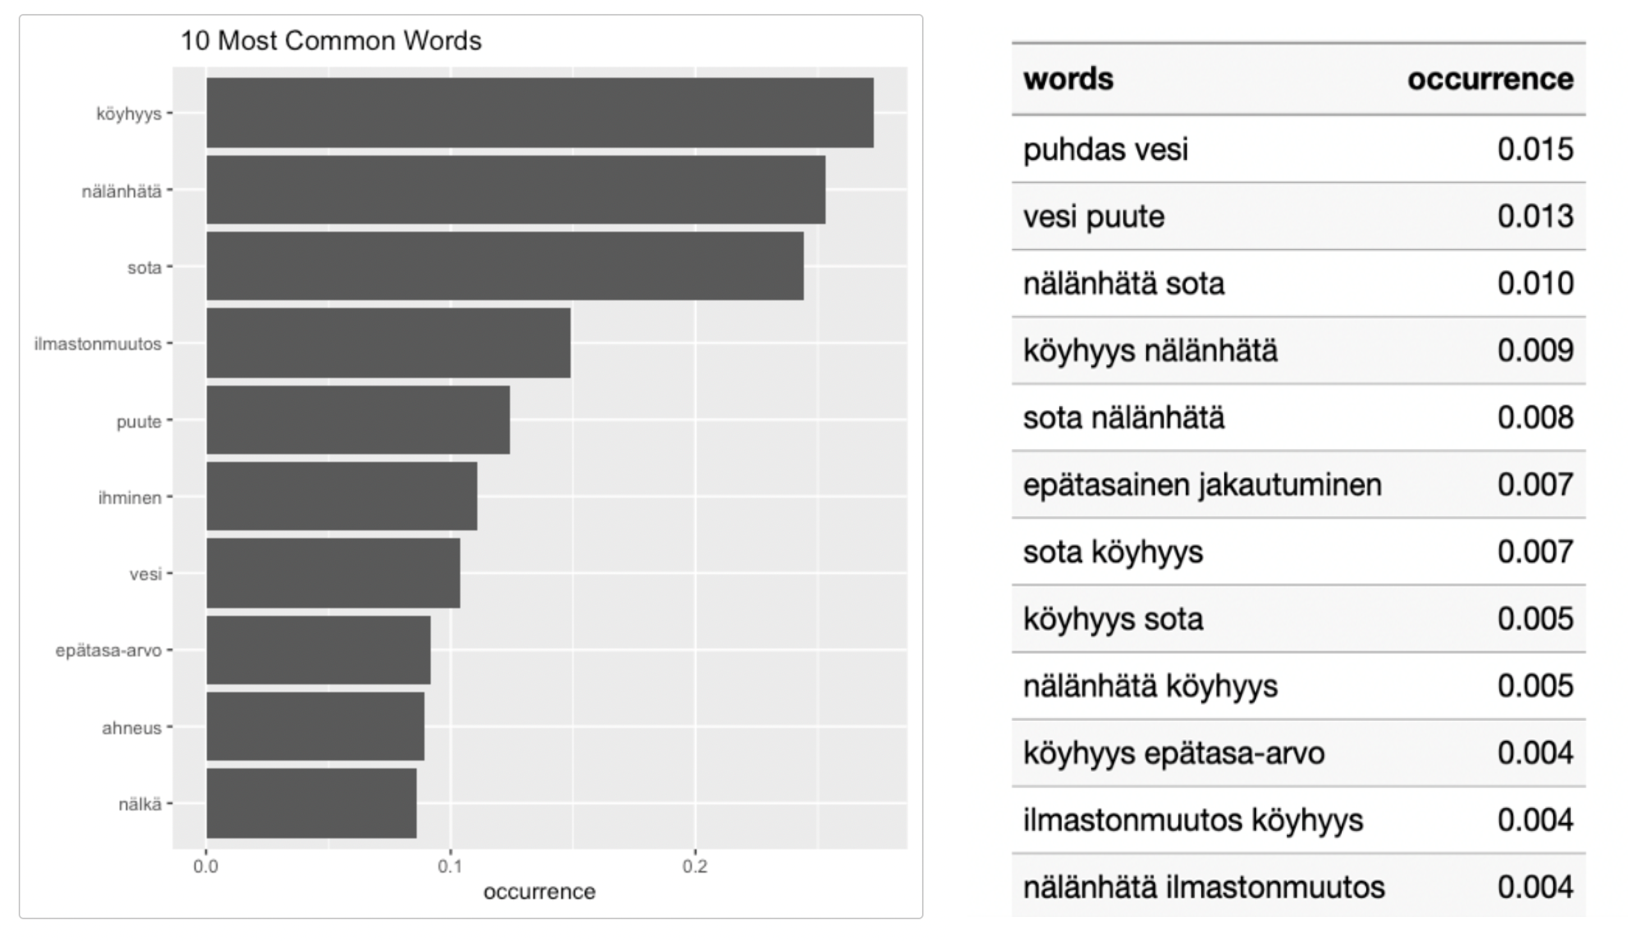
These top words can be more easily quantified through the ‘most common words’ visualisations and tables. The most common words plot shows that over 20% of survey respondents mentioned each of our top three words: ‘köyhyys‘ (poverty), ‘nälänhätä‘ (hunger) and ‘sota‘ (war) and the bigrams table shows that ‘puhdas vesi’ (clean water) is the most common two-word phrase in the responses.
For all EDA functions, and the concept network described below, common words can be excluded from analysis based on part-of-speech tag or because they’re in a list of ‘stopwords’ (such as ‘olla’, ‘olen’, ‘olet’).
The Concept Network
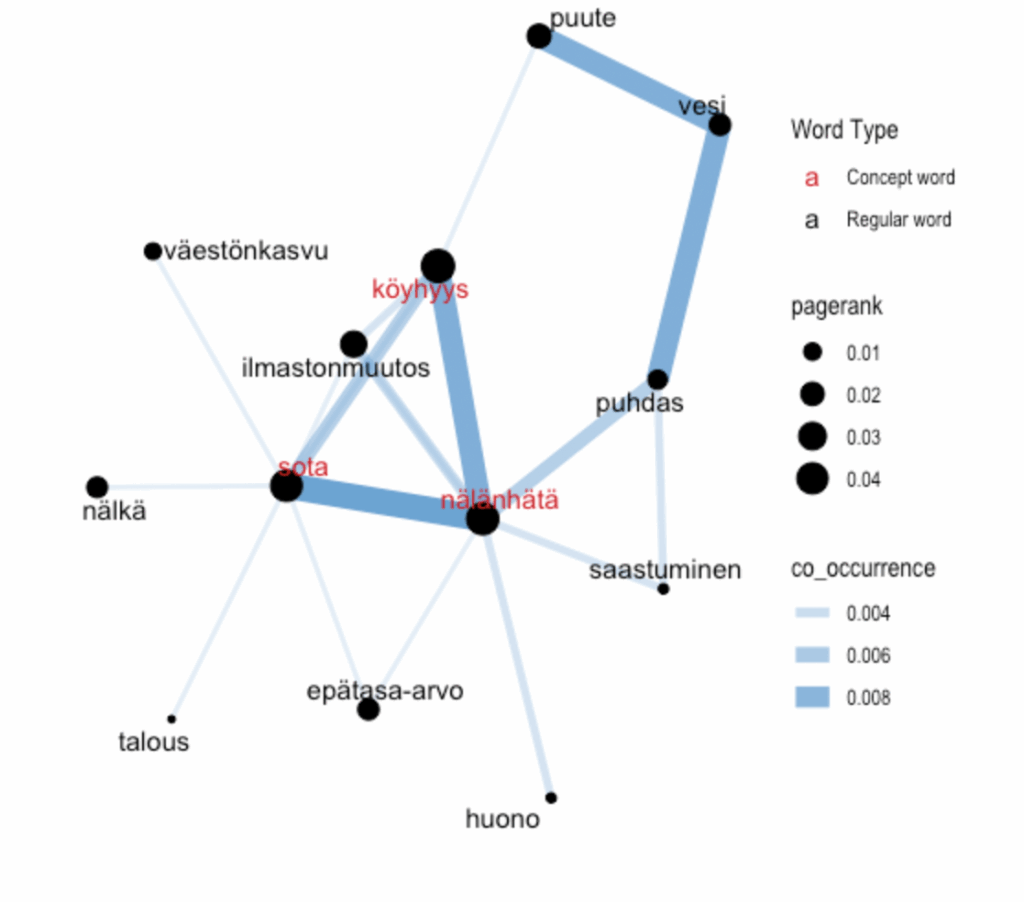
The final component of the package is the concept network functions which builds upon the exploratory data analysis to provide a contextualised visualisation of identified key words. It is valuable for a researcher to understand what kind of ideas co-occur frequently in the responses to open-ended survey questions. One way to reveal these co-occurrences is through a concept network constructed of keywords which is generated by word importance and co-occurrence between words. Such a network requires keywords to be identified, and their relative importance quantified. Our functions identify these using the TextRank algorithm which is a graph-based ranking model derived from the PageRank algorithm which Google uses to rank webpages. This method recursively weights a word based on the importance of other words in the entire network. One significant advantage of using this unsupervised approach is that TextRank does not require training corpora, making it widely adaptable to any language or domain. Thus, such an algorithm is appropriate for use on Finnish text. In our example, we show words that are commonly used with our top three words ‘sota’, ‘köyhyys’ and ‘nälänhätä’ (in red below).
Comparisons based on other survey questions
We have also included counterpart comparison functions for each analysis function with the finnsurveytext package. These functions compare responses between groups of participants. One way to split the data is using a different question within the survey such as a categorical question (e.g. gender, location, or level of education) or an ordinal variable (such as age or income bracket). These counterpart functions highlight differences that are identified between each group. In these example plots, we are comparing responses between male and female survey participants who mention the top three words. We can see from the concept network that there is more variation in female responses using these words.
How to download and use the package
The finnsurveytext R package is now available for users to install from the central software repository for the R programming language, the CRAN (https://CRAN.R-project.org/package=finnsurveytext).
The package website (https://dariah-fi-survey-concept-network.github.io/finnsurveytext/) contains tutorials covering all the functions included in the package.
The package is the result of collaboration between the Universities of Eastern Finland, Helsinki, Jyväskylä, and Turku in DARIAH-FI. This and other resources are available here.
Experiences from CRAN submission and packaging the process
We decided to submit the work to CRAN to disseminate the tool to make it as easy as possible for scholars to access and use. The R language was chosen for our package as it is widely used within the social sciences. Additionally, R and programs for running R, such as RStudio, are freely available and there are lots of free resources for learning and using the R language. Finally, there are many data analysis packages already available through the CRAN which could be used with our package to analyse a full survey of closed and open-ended questions. As the main repository for the R language, the CRAN was chosen because it is easy for users to install these packages and because the CRAN submission process checks packages and ensures they are ready for use.
We created the finnsurveytext R package in RStudio following the instructions in R Packages by Hadley Wickham and Jennifer Bryan. We highly recommend using this book – which is available for free online – if you’re creating a package that is going to be shared widely (such as on the CRAN). Following the book’s advice means that you will design the package to meet the CRAN requirements – some of which can feel quite arbitrary – as you go, which saves considerable effort required to go back and rework the package later to meet these requirements. The book also teaches you to use the devtools meta package which aims to “make package development as painless as possible” by including many functions required during package development and testing. We also recommend using RStudio as your integrated development environment (IDE) as we found this IDE works very well with devtools to simplify the entire package development process.
Once your package is written, there is a checklist included in R Packages which guides you through the final testing and submission process such as writing release notes, completing the ‘DESCRIPTION’ metadata file correctly, and updating the release number. Before submission, developers need to eliminate all error and warning messages which come up during package checks and conduct additional automated checks to ensure the package meets CRAN policies and works for multiple operating systems. The final step is the manual inspection where a CRAN volunteer conducts a final check of the package before it is uploaded to the CRAN. The process can involve a bit of back-and-forth, but our experience is that it is much simpler and quicker having followed the process and advice outlined in R Packages than it would have been otherwise.